complexity of color by taewook kang from korea
designer's own words:
concept:
Until today in the social system, color has been seen only as a medium that conveys information.
Color itself appeals to the public in symbolic representations as in “go” and “stop” in traffic lights or “cold”and “warm” on water-taps.
But if color which is an one-dimensional element could be used together with numbers and length which are also one-dimensional elements,
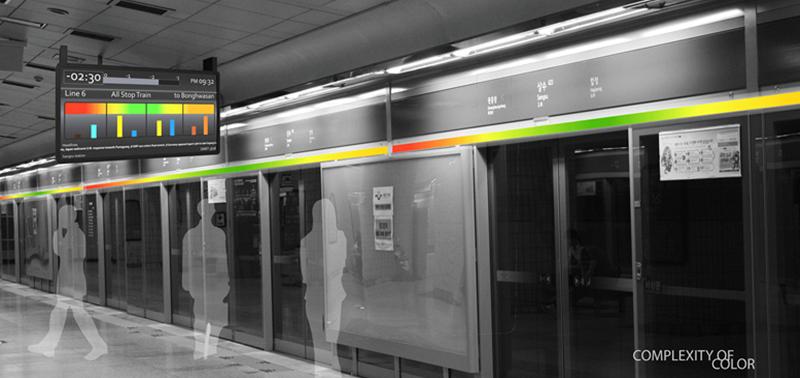
color could then be conveyed as two-dimensional or complex information. A particular space that we should pay attention to, is the subway station.
At the moment there are no methods of information that is conveyed that influence the mass crowd such as in seats, sounds and temperature.
The main aim of this project is to provide complex information that can lead to more efficient usage of the subway just by complexity of color.
diagram:
1.Each color contains a meaning in all cultures. The image above shows the symbolic meanings
of different colors in everyday life and the feelings that people get by looking at these colors.
This project will be progressed using these meanings and symbolic representation in color.
(“The magic of colors” by Tamamoto Takashi has been used as a source of this information.)
2.By assembling the meanings in simple, one-dimensional information,
a more compound information that carries various messages can be formed
device:
Using this concept, a new information display for the subway platform has been designed to replace the existing device.
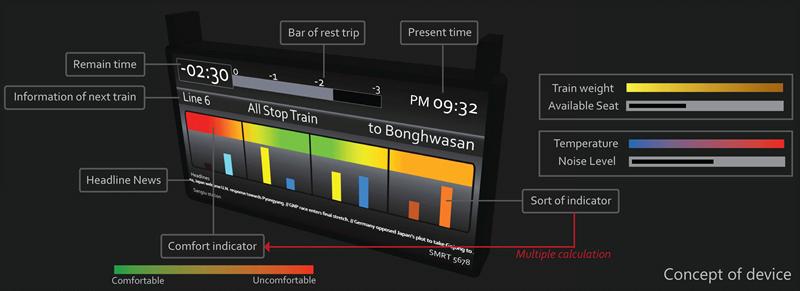
In the new design there are four sensors: the train-weight sensor, the chair-pressure sensor, the noise-level measurement sensor and the temperature measurement sensor. With the information given through these sensors, the weight of the train and the room temperature is calculated and then expressed through colors. Likewise, the number of seats that are available and the noise level of the area is expressed through length. The train-weight and the seats available, and the temperature and noise-level are grouped in to 2 sets which are then expressed in separate color bars with different lengths.
The majority of the users are more interested in the comfortability of the subway rather than detailed measurements. So the four variables are calculated to show the comfort level of each subway compartments through colors. The users then can board the subway after grasping the comfort-level by looking at the color on each compartment. Users that are sensitive to sound and temperature can board the compartment of their choice by looking at the color bars with calculated lengths.
The existing direction indicators in the subway can also be transformed in to a bar shape that is easily readable which shows the amount of time left until the next train arrives. This can lead to a more efficient and accurate usage of the subway.
three-dimensional image
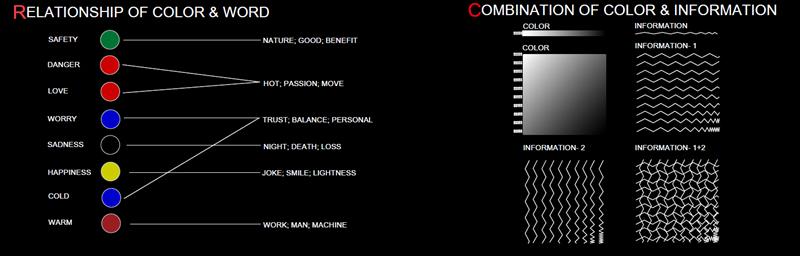 diagram of color
 concept of device