‘dérive‘ or ‘drift’ by françois quévillon all images courtesy of the artist 
french-canadian installation and media artist françois quévillon has shared with designboom his hypnotic digitized visualizations of environmental patterns moving over time viewed from a particular point in space. the project ‘dérive’ or ‘drift’ fits into his preferred exploratory path as quévillon notes that his work typically investigates ‘phenomena of the world and perception through the implementation of processes sensitive to the public’s interference and to the environment’s variable conditions‘. software for the three-dimensional data projections for the artist’s project were developed for the project by edouard lanctôt-benoit.
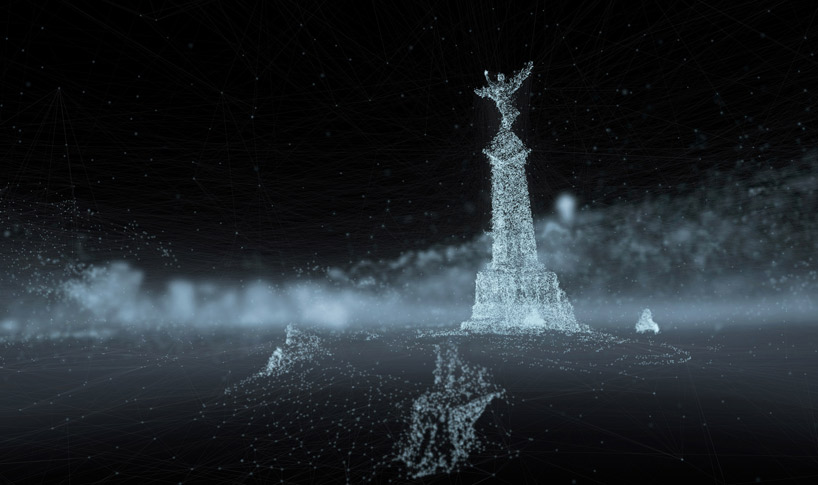
the artist says of ‘drift’: ‘this interactive installation invites to explore 3d models of spaces that are transformed according to environmental data collected in real time on the web. a computer vision interface enables the public to interact with a representation which’s appearance and level of recognition are determined by information on local meteorological and astronomical phenomena. in addition to their visualization, the data transmitted by remote environmental sensors are sonified. dérive was initiated during the géographies variables residency program in april 2010. inspired by lidar datasets and the growing number of augmented mapping applications, models of distant locations were created by the use of photogrammetry, geomatic data and traditional modeling. these 3d point clouds provide fixed xyz coordinates that are used in a changing virtual space which reassembles a dynamic particle system. the display and positions of the points and of the wireframe connecting them are determined by the following environmental information as a mean to evoke or simulate them‘.
 as the information about weather conditions shift, so does the screen’s display
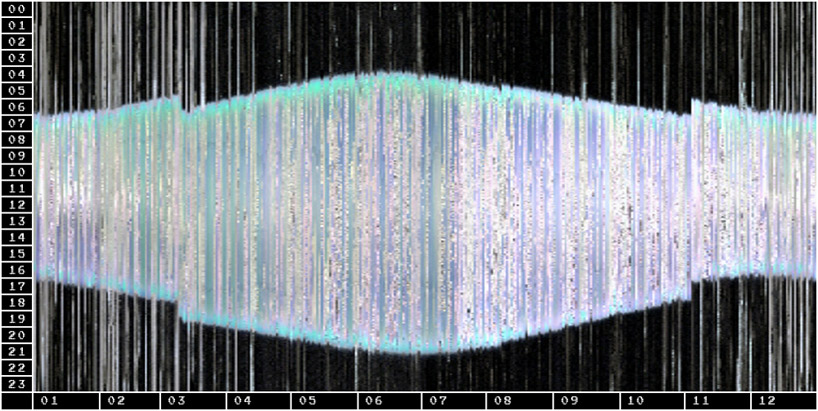 the graph represents a range of temperature and movement
the following data is synthesized in order to create each piece: local time : point size and brightness (relative to sunrise and sunset) temperature : point color cloudiness : point saturation and brightness wind : point displacement reflecting speed and direction visibility : intensity of a depth of field effect and transparency humidity : depth of field focus distance and point sharpness precipitation : random lines drawn from the sky are connected to the ground
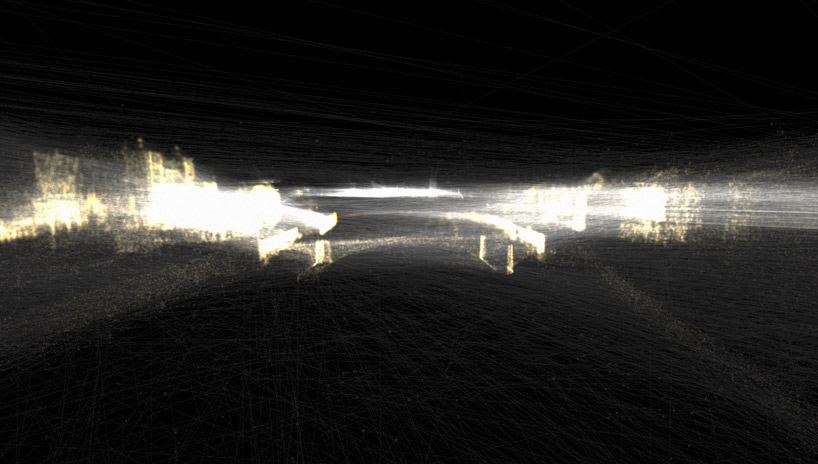
 wide perspective of ‘drift’ data moving across the screen
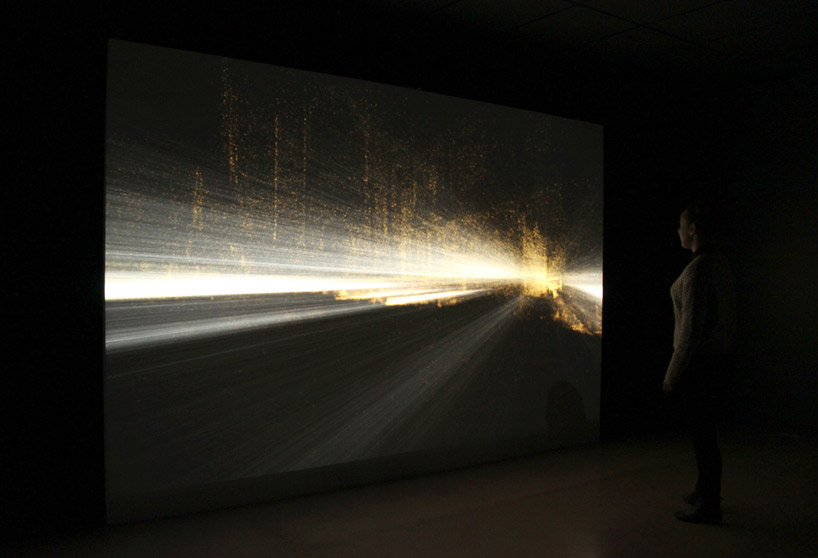 when a movement of a particular weather pattern grazes over a particular zone, this steady drift is pictured in the project
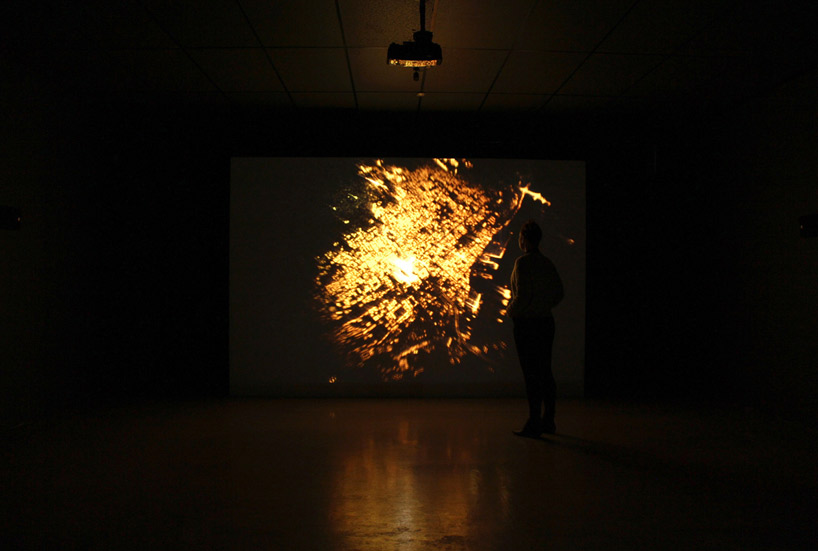
 additional view picturing the visualization of weather data
‘dérive [data::simulation] françois quévillon’ by perte de signal
PRODUCT LIBRARY
 Sep 11, 2024
 Jul 15, 2024