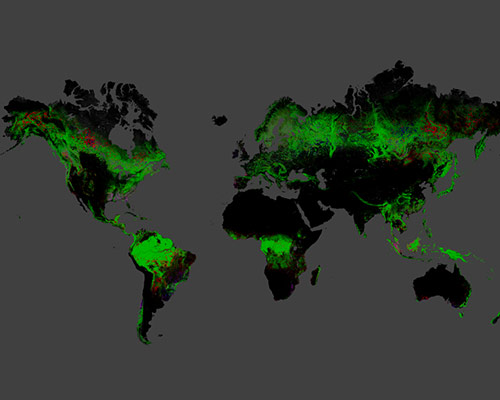
google highlights global deforestation with interactive map
image courtesy of google earth
google earth has partnered with a research team at the university of maryland in the realization of an interactive, digital map that highlights global forest change. the data used has been compiled from the results of a decade long analysis of 654,178 landsat images. each color indication on the interface corresponds to collected informational evidence: red — forest loss from 2000-2012; blue — forest gain from 2000-2012; magenta — both loss and gain; green — forest extent.
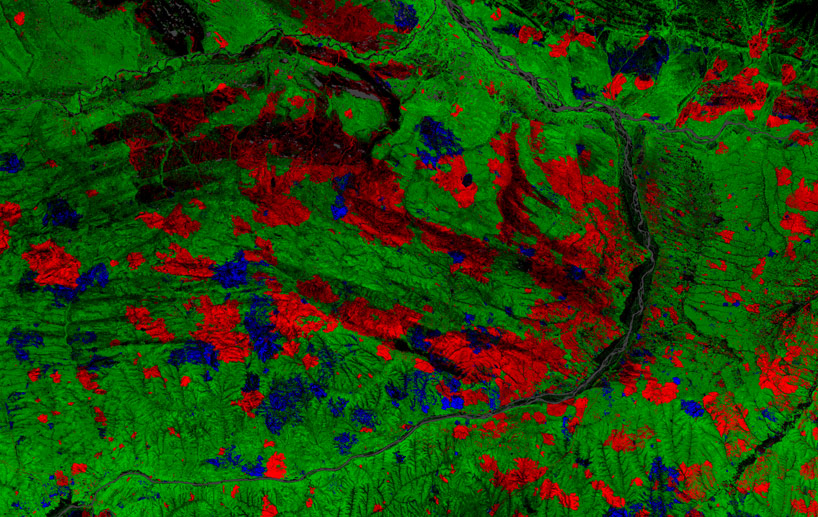
zoomed view of forest fires in the siberian larch forests of yakutia, russia
the visualizations reveal various trends of both forest gain and loss from a number of destinations around the world. the patterns range from the destruction of the tuscaloosa-birmingham tornado, to forest fires in the siberian larch forests of yakutia, russia, and devastation in sumatra, indonesia, which has lost over 50% of its natural forest within the past 30 years. in the published report, author matthew hansen, professor of geological sciences at the university of maryland, points out that ‘the tropics were the only climate domain to exhibit a trend, with forest loss increasing by 2101 square kilometers per year. brazil’s well-documented reduction in deforestation was offset by increasing forest loss in indonesia, malaysia, paraguay, bolivia, zambia, angola, and elsewhere.‘
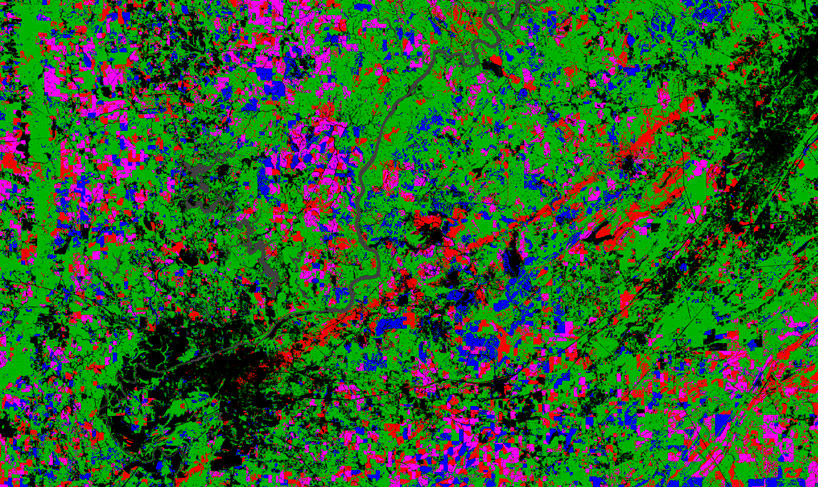
patterns of forest growth and loss from the destruction of the tuscaloosa-birmingham tornado
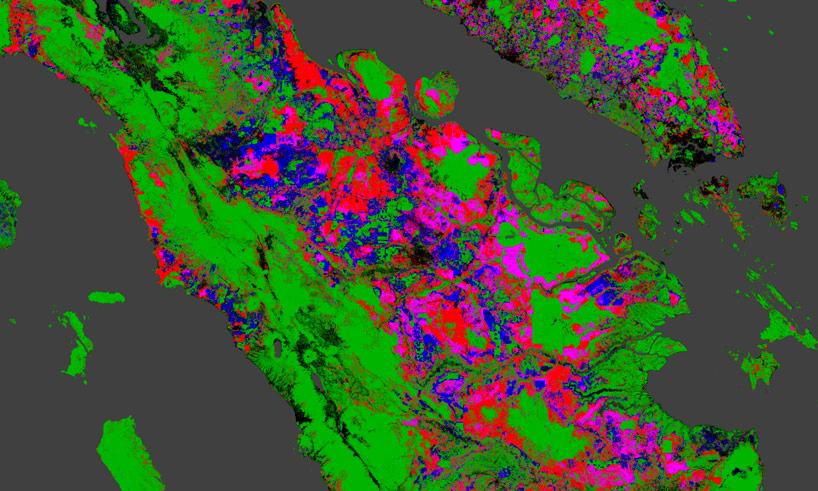
sumatra, indonesia has lost over 50% of its natural forest within the past 30 years
